|
|
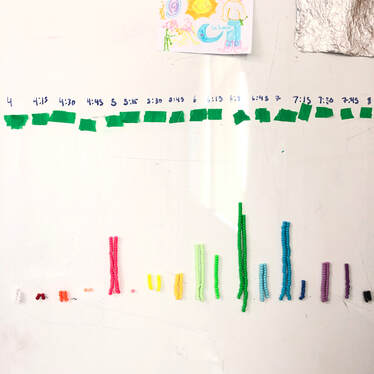
Our project was supposed to incorporate calculus and graphing. We chose our question that was tallied up specifically so we could achieve a bell curve that could be analyzed. We had 95 responses and to graph them in our final bead representation we doubled how many responses each option got to accentuate the quantities and show the curve better.
We chose our question: “How early do you get up for school?” because there would be a variant of answers that would give us a large graph to work with. We also know it would create a curve somewhere because answers were bound to be similar and some options were bound to not be chosen. It worked out pretty well and our graph accurately displays our information in a compelling, colorful manner.
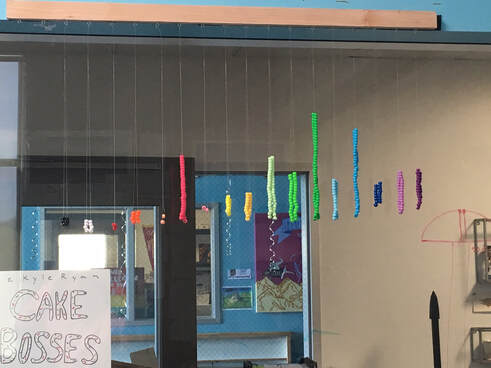
